Metrics & Analytics

Photo by Michael Dziedzic on Unsplash
BIBLIOMETRICS – authors, journals, indexes, research metrics and analytics
Bibliometrics
Bibliometrics is the use of statistical methods to analyse books, articles and other publications. Bibliometric methods are frequently used in the field of library and information science. The sub-field of bibliometrics which concerns itself with the analysis of scientific publications is called scientometrics.
You can get bibliometrics from the following services: Scopus – Provides citation counts, analysis, SCImago Journal Rank (SJR) scores and more. Web of Science platform: Introduction – Provides citation counts, analysis and more.
How to Analyse Your Publication Impact Using Bibliometrics – Massey University, NZ
algorithm – a sequence of instructions where the main goal is to solve a specific problem, perform a certain action, or computation – ie. to calculate data about a paper, author or journal.
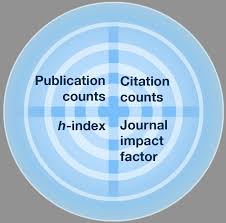
image by Maurizio Naldi
In recent years, research metrics, like scholarly output and citation counts, have been added to into formulas / algorithms to measure and assess author and journal impact including:
- Journal Impact Factor
- h-index
- g-index
- Eigenfactor score
- Altmetric
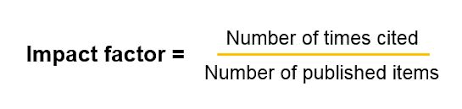
Impact Factor
measures how often an average article in a journal has been cited.
The impact factor was devised by Eugene Garfield, the founder of the Institute for Scientific Information (ISI). Impact factors are calculated yearly starting from 1975 for journals listed in the Journal Citation Reports (JCR). ISI was acquired by Thomson Scientific & Healthcare in 1992,[1] and became known as Thomson ISI. In 2018, Thomson ISI was sold to Onex Corporation and Baring Private Equity Asia.[2] They founded a new corporation, Clarivate, which is now the publisher of the JCR.
In any given year, the two-year journal impact factor is the ratio between the number of citations received in that year for publications in that journal that were published in the two preceding years and the total number of “citable items” published in that journal during the two preceding years:[4][5]

For example, Nature had an impact factor of 41.577 in 2017:[6]

This means that, on average, its papers published in 2015 and 2016 received roughly 42 citations each in 2017. Note that 2017 impact factors are reported in 2018; they cannot be calculated until all of the 2017 publications have been processed by the indexing agency.
The value of impact factor depends on how to define “citations” and “publications”; the latter are often referred to as “citable items”. In current practice, both “citations” and “publications” are defined exclusively by ISI as follows. “Publications” are items that are classed as “article”, “review” or “proceedings paper”[7] in the Web of Science (WoS) database; other items like editorials, corrections, notes, retractions and discussions are excluded. WoS is accessible to all registered users, who can independently verify the number of citable items for a given journal. In contrast, the number of citations is extracted not from the WoS database, but from a dedicated JCR database, which is not accessible to general readers. Hence, the commonly used “JCR Impact Factor” is a proprietary value, which is defined and calculated by ISI and can not be verified by external users.[8]
New journals, which are indexed from their first published issue, will receive an impact factor after two years of indexing; in this case, the citations to the year prior to Volume 1, and the number of articles published in the year prior to Volume 1, are known zero values. Journals that are indexed starting with a volume other than the first volume will not get an impact factor until they have been indexed for three years. Occasionally, Journal Citation Reports assigns an impact factor to new journals with less than two years of indexing, based on partial citation data.[9][10] The calculation always uses two complete and known years of item counts, but for new titles one of the known counts is zero. Annuals and other irregular publications sometimes publish no items in a particular year, affecting the count. The impact factor relates to a specific time period; it is possible to calculate it for any desired period. For example, the JCR also includes a five-year impact factor, which is calculated by dividing the number of citations to the journal in a given year by the number of articles published in that journal in the previous five years.[11][12]
Latest news: 2021 Journal Impact Factor (JIF) to be based on the date of electronic publication and not the date of print publication
The JCR Reload and a look ahead to the introduction of early access content in 2021
Changes to Journal Impact Factor Announced for 2021, by Phil Davis, Dec 7, 2020, Scholarly Kitchen
Clarivate Analytics has announced that it is moving towards calculating the Journal Impact Factor (JIF) based on the date of electronic publication and not the date of print publication. as Davis says:
Given the potential of changing the ranking of journals, I asked Hubbard whether he or his team had tested whether adding Early Access citations changed the ranking of journals or whether it preferentially benefited participating publishers. At the time of this writing, I have not received a response.
The changes at Clarivate are welcome and long overdue. While it is not clear how a shift from print to online publication dates will affect the ranking of journals, it should help to reduce ambiguity and confusion in the citation record. A lack of transparency and communication on the anticipated effects of this transition are troubling however, especially because they currently involve just one-half of active journals. If arriving at a fair and unbiased assessment means waiting another year for all publishers to participate, I’m personally willing to wait.
Eigenfactor
- indicates the overall contribution of the journal, as a whole, to the literature in a field
The Eigenfactor came out of the Metrics Eigenfactor Project in 2008, a bibliometric research project conducted by Professor Carl Bergstrom and his laboratory at University of Washington.
The Eigenfactor Score measures the number of times articles from the journal published in the past five years have been cited in the Journal Citation Reports (JCR) year.
Like the Impact Factor, the Eigenfactor Score is essentially a ratio of number of citations to total number of articles. However, unlike the Impact Factor, the Eigenfactor Score:
- Counts citations to journals in both the sciences and social sciences.
- Eliminates self-citations. Every reference from one article in a journal to another article from the same journal is discounted.
- Weights each reference according to a stochastic measure of the amount of time researchers spend reading the journal.
Eigenfactor scores are scaled so that the sum of the Eigenfactor scores of all journals listed in Thomson’s Journal Citation Reports (JCR) is 100.
The Eigenfactor uses Thomson Reuters Web of Science citation data.
Further Reading: Eigenfactor: Measuring the value and prestige of scholarly journals, Carl Bergstrom, College & Research Libraries News, May 2007
SSCI
Web of Science: Social Sciences Citation Index published by Clarivate

Web of Science
 The Web of Science indexes more than 11,500 science and social science journals.[13]
Web of Science Journal Evaluat
Social Sciences Citation Index™ contains over 3,400 journals across 58 social sciences disciplines, as well as selected items from 3,500 of the world’s leading scientific and technical journals. More than 9.37 million records and 122 million cited references date back from 1900 to present.
 Our expert in-house editors use a single set of 28 criteria throughout the journal selection and curation process. Divided into 24 ‘quality’ criteria and four ‘impact’ criteria, our editors select the most influential journals in their respective fields (using citation activity as the primary indicator of impact) for the Social Sciences Citation Index.
Scopus

Scopus, by Elsevier, is the largest abstract and citation database of peer-reviewed literature: scientific journals, books and conference proceedings. Delivering a comprehensive overview of the world’s research output in the fields of science, technology, medicine, social sciences, and arts and humanities, Scopus features smart tools to track, analyze and visualize research.
Scopus offers free features to non-subscribed users, and is available through Scopus Preview. Researchers may use Scopus to assist with their research, such as searching authors, and learning more about Scopus content coverage and source metrics.
Scopus Content Policy and Sele
H-Index
The h–index is an index to quantify an individual’s scientific research output (J.E. Hirsch) The h–index is an index that attempts to measure both the scientific productivity and the apparent scientific impact of a scientist. The index is based on the set of the researcher’s most cited papers and the number of citations that they have received in other people’s publications (Wikipedia) A scientist has index h if h of [his/her] Np papers have at least h citations each, and the other (Np − h) papers have at most h citations each.
Find your h-index at:
Google Scholar Citations

Google Scholar Citations provide a simple way for authors to keep track of citations to their articles. You can check who is citing your publications, graph citations over time, and compute several citation metrics. You can also make your profile public, so that it may appear in Google Scholar results when people search for your name, e.g., richard feynman.
Best of all, it’s quick to set up and simple to maintain – even if you have written hundreds of articles, and even if your name is shared by several different scholars. You can add groups of related articles, not just one article at a time; and your citation metrics are computed and updated automatically as Google Scholar finds new citations to your work on the web. You can choose to have your list of articles updated automatically or review the updates yourself, or to manually update your articles at any time.
Altmetrics
- Altmetrics are non-traditional metrics that are an alternative to citation impact metrics.

Altmetric is a company founded in 2011 by Euan Adie. Altmetric tracks and displays online activity (social media sites, newspapers and magazines for mentions of each published article) The aim is to help authors quantify the attention their article is receiving and to help readers establish the articles their peers think are interesting.
‘Our mission is to track and analyze the online activity around scholarly research outputs.’
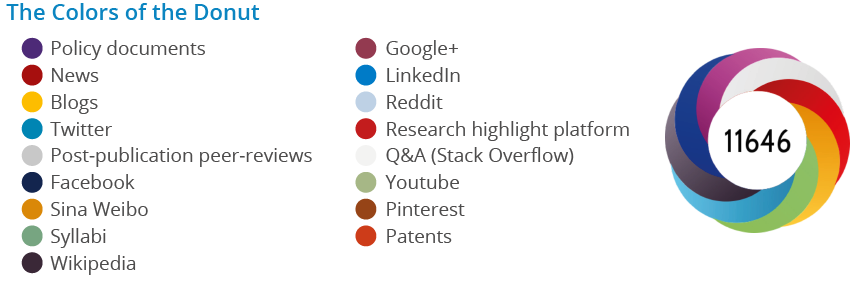
The Altmetric Attention Score and donut are designed to help you easily identify how much and what type of attention a research output has received.
Citations
A decisive topic in journal ranking is journal abbreviation in citations.
One-word title journals (e.g.
Other journals
Some publishers deliberately a
For pri
So … by losing hundre
Links:
Many University Library sites and Research Guides sites now have some explanations about these bibliometric systems:
Auckland University of Technology, AUT, New Zealand
University of Illinois, USA. see the table calculating bibliometrics
University of Illinois Chicago, UIC, USA
University of Maryland, USA, Research Guides
Diem, Andrea; Wolter, Stefan C. (2012-06-06). “The Use of Bibliometrics to Measure Research Performance in Education Sciences” (PDF). Research in Higher Education. 54 (1): 86–114. doi:10.1007/s11162-012-9264-5. ISSN 0361-0365. S2CID 144986574
Calculating Bibliometrics
Calculating metrics can sometimes be complicated and confusing. This table provides a brief introduction to each calculation and what it means.
| Metric | Website | Calculation | Meaning |
|
Impact Factor |
|
Use a two-year period to divide the number of times articles were cited by the number of articles that were published
Example: 200 = the number of times articles published in 2018 and 2019 were cited by indexed journals during 2020. 73 = the total number of “citable items” published in 2018 and 2019.
200/73 = 2.73 2020 impact factor |
Impact factor reflects only on how many citations on a specific journal there are (on average). A journal with a high impact factor has articles that are cited often. |
|
h-index |
|
1) Create a list of all of your publications. organize articles in descending order, based on the number of times they have been cited.
2) Look down through the list to figure out at what point the number of times a publication has been cited is equal to or larger than the line (or paper) number of the publication.
*please remember that many databases will give you this number; this is only if you’d like to calculate it manually. You can also often find calculators online. *graphic courtesy of the University of Waterloo Libguide |
The h-index focuses more specifically on the impact of only one scholar instead of an entire journal. The higher the h-index, the more scholarly output a researcher has. |
|
g-index |
|
Given a list of articles ranked in decreasing order of the number citations that they received, the g-index is the largest unique number to the extent that the top g articles received together is at least g2 citations. |
The g-index can be thought of as a continuation of the h-index. The difference is that this index puts more weight on highly-cited citations. The g-index was created because scholars noticed that h-index ignores the number of citations to each individual article beyond what is needed to achieve a certain h-index. This number often complements the h-index and isn’t necessarily a replacement. |
|
Eigenfactor score |
|
The Eigenfactor score is calculated by eigenfactor.org. However, their process is very similar to calculating impact factor and they pull their data from the JCR as well. The major difference is that the Eigenfactor score deletes references from one article in a journal to another in the same journal. This eliminates the problem of self-citing. The Eigenfactor score is also a five-year calculation. More information can be found through Journal Citation Reports. |
A high Eigenfactor score signals that the journal does not self-cite and controls the network of that discipline. It’s useful to look at scholar’s h-index as well as the Eigenfactor score of the journals they publish in in order to get a broad sense of their impact as a researcher. |
|
Altmetric |
|
Altmetric scores are usually calculated by companies. This means that they can’t be calculated manually. To see an explanation of how this metric is caculated, you can visit the Altmetric support page. |
Different sources go into altmetrics calculations, depending on the company and the information that they are using. But in general, a high altmetric score indicates that an item has received a lot of attention and it has also received what that company has decided is “quality” attention (i.e. a news post might be more valuable than a twitter mention). Remember that attention doesn’t necessarily indicate that the article is important or even of quality. That’s why it’s useful to use altmetrics and impact factor together. |